

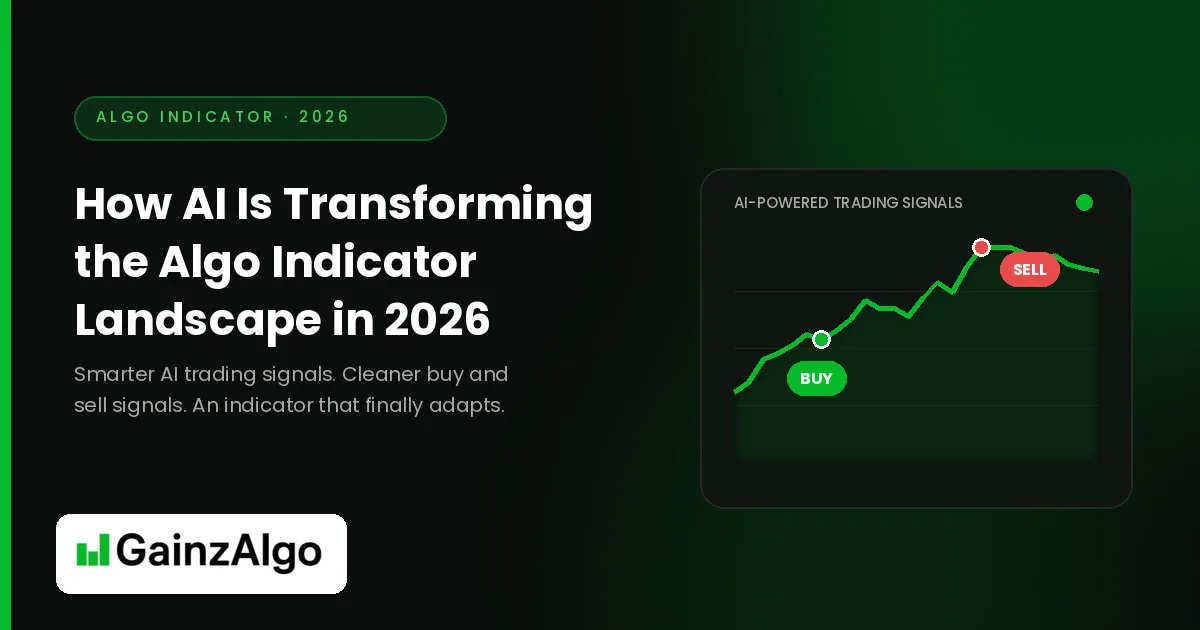
AI Algo Indicator in 2026: Smarter Trading Signals Now
- afaq anser
- Technology
- 2026-08-26 16:41:36
- 2819K
I have watched charts for two decades. In that time, I have seen three real shifts in how traders read price. First came the classic oscillators. Then came scripting platforms, which let anyone code a rule. Now artificial intelligence has arrived, and it has changed the job description of the modern algo indicator.
The change runs deeper than a new colour on your chart. In 2026, a good algo indicator no longer just reacts to price. Instead, it interprets conditions. It weighs volatility, structure, session timing, and momentum together. Then it speaks in plain language: buy here, sell there, or stand aside.
This article explains what actually changed, why it matters for your results, and how to judge these tools without getting sold a dream.
What an Algo Indicator Really Does Today
An Algo Indicator is a rules-based tool that scans price data and marks opportunities for you. Traditionally, those rules were fixed. A moving average crossed. A stochastic hit 80. The tool printed an arrow, and that was that.
Modern tools work differently. They still follow rules, yet the rules now flex with conditions. A 2026-era trading indicator might tighten its filters during choppy sessions and loosen them during clean trends. As a result, the same tool behaves like two different tools in two different markets.
That flexibility is the heart of the shift. Traders used to adapt to their indicators. Now the indicators adapt to the market.
Why the Old Approach Started to Break
Let me be direct, because this part matters. Static indicators never really failed at maths. They failed at context.
Consider a simple RSI strategy. It works beautifully in ranging conditions. However, it bleeds capital in a strong trend, because "overbought" keeps getting more overbought. The formula was never wrong. The environment simply changed, and the formula could not tell.
Markets also grew faster. Liquidity moved to shorter timeframes. News hit charts within milliseconds. Meanwhile, retail traders gained access to the same data feeds that institutions use. Because of that speed, lagging tools produced late entries, and late entries produced small losses that compounded quietly.
Traders responded by stacking more indicators on one chart, hoping volume of opinion would replace quality of logic. Unfortunately, that rarely helped. Six lagging tools still lag. They just lag in unison, and they make the chart harder to read.
Five Ways AI Changed the Landscape
Artificial intelligence did not invent technical analysis. Rather, it upgraded how technical analysis gets applied. Here are the five changes I consider genuinely significant.
1. Indicators Now Tune Themselves
Older tools asked you to pick a setting. You chose a 14-period lookback, or maybe a 21. Then you hoped that number stayed useful.
AI-driven tools handle this differently. They measure current volatility and adjust their sensitivity in real time, without asking you for input. During quiet ranges, they demand stronger confirmation. During expansion, they react sooner. Consequently, the tool stays calibrated without constant manual tweaking.
This single change removes a huge source of user error. Most traders were never optimising settings well anyway. Honestly, most were curve-fitting to last month's chart.
2. Signals Read Context Before They Fire
This is the biggest leap, in my view. Modern AI trading signals do not fire on one condition. Instead, they check several layers first.
A well-built engine asks a series of questions. Is the higher timeframe trending or ranging? Is volume supporting the move? Are we inside a session with real liquidity? Does structure sit nearby, or is there room to run?
Only when enough answers align does the algo indicator print an entry. Therefore, you get fewer signals, but the surviving ones carry more weight. Quality replaces quantity, which is exactly the trade most profitable traders want.
3. Machine Learning Filters the Noise
Noise filtering used to mean smoothing. Smoothing, however, always costs you speed. You either react early and get faked out, or react late and miss the move.
Machine learning offers a third path. Models study thousands of historical setups and learn which patterns preceded follow-through. They then score new setups against that history. Low-scoring setups get suppressed before they ever reach your screen.
The result feels subtle at first. You simply notice fewer bad arrows on the chart. Over a month, though, that difference shows up clearly in your equity curve.
4. Multi-Timeframe Confluence Happens Instantly
Experienced traders have always checked multiple timeframes. That process took time and discipline. Many traders skipped it under pressure.
AI-powered trading signals automate that check. The engine reviews the daily, the hourly, and your execution timeframe at once. Then it reports one clean verdict. In practice, this saves several minutes per decision, and it removes the emotional temptation to ignore a conflicting higher timeframe.
5. Backtesting Became the Minimum Standard
Ten years ago, indicator sellers showed screenshots. Today, serious developers publish tested results across years and instruments.
This change came from traders themselves, who grew tired of unverifiable claims. Now the expectation is far clearer. If a tool prints buy and sell signals, its creator should show how those signals performed across bull markets, bear markets, and dead sideways periods.
I treat this as non-negotiable. Any tool without transparent testing belongs in the demo account, not the live one.
What Better Buy and Sell Signals Look Like on a Chart
Let me describe the practical difference, because theory only goes so far.
An older tool might print fifteen arrows during a session. Some worked. Many did not. You then spent your energy guessing which arrows to trust, which defeats the purpose of using a tool at all.
A modern algo indicator behaves more like a selective analyst than a signal machine. It might print three signals in that same session. Each one arrives with context you can verify quickly. Trend agrees. Volume agrees. Structure allows movement.
Furthermore, good tools now mark invalidation clearly. They tell you where the idea stops being valid. That single feature protects accounts more than any entry logic ever will, because it forces the exit decision before emotion arrives.
How These Systems Get Built Behind the Scenes
Transparency builds trust, so here is a simplified look at the development process.
Developers start with raw market data across many years and instruments. They clean that data carefully, since gaps and bad ticks ruin results silently. Next, they define features: volatility measures, trend strength readings, volume behaviour, and structural levels.
After that, they train models on one slice of history and test them on a completely separate slice. This step separates honest work from marketing. A model that only performs on data it has already seen has learned nothing useful.
Finally, the team runs forward testing in live conditions. They watch slippage, spread, and execution timing. Only then does a trading indicator reach real users.
Skipping any stage produces the same familiar story. Beautiful backtest, disappointing reality.
A Lesson From My Own Screen
Early in my career, I ran a simple crossover system on the euro. It printed clean signals, and I trusted every one of them. For six weeks, it performed well. Then the market shifted into a tight range, and the same system handed back three months of gains.
The system had not broken. My understanding had. I never asked whether conditions still suited the logic, because the tool could not tell me.
That experience shapes how I evaluate every algo indicator today. I no longer ask, "How accurate is it?" Instead, I ask two better questions. In which conditions does this tool excel? And when does it stay quiet?
Modern AI trading signals answer both questions directly. Good engines label the regime they detect. Some even reduce signal frequency when confidence drops. Consequently, you are not left guessing whether the tool understands the current market.
That honesty is worth more than a headline win rate. A tool that skips forty questionable setups has protected your capital forty times, even though nothing appeared on your chart.
The Risks Nobody Should Ignore
I would be doing you a disservice if I only listed benefits. So let me name the real dangers.
Overfitting remains the most common problem. A model can memorise history instead of learning from it. Such a model looks perfect in testing and falls apart within weeks.
Black-box logic creates a second issue. If you cannot understand roughly why a signal fired, you will abandon the system during its first losing streak. Every system has losing streaks. Understanding builds the patience to survive them.
Finally, no tool replaces risk management. AI can improve your entries meaningfully. It cannot save an account that risks 20% per trade. Position sizing still decides who survives the year.
How to Judge an AI Algo Indicator Before You Trust It
Use this short checklist before you commit money to any tool.
- Ask for multi-year testing. One good quarter proves nothing.
- Check performance across conditions. Trends, ranges, and crashes all matter.
- Look for clear invalidation levels. Entries without exits are incomplete.
- Demand explainable logic. You should grasp the reasoning in plain language.
- Test on demo for at least four weeks. Your discipline needs a trial run too.
- Confirm it suits your timeframe. A scalping engine will frustrate a swing trader.
Additionally, watch how a developer talks about losses. Honest teams discuss drawdown openly. Marketing-led teams hide it, and that silence tells you everything.
Where the Landscape Goes Next
Two trends look likely through the rest of this decade.
First, personalisation will deepen. With advancing technology, tools will learn your habits, your risk tolerance, and your preferred sessions. Then they will filter signals to match your style rather than a generic template.
Second, explanation will improve across the board. Powered by smarter technology, instead of a bare arrow, you will read a short summary: trend aligned, volume rising, resistance clear above. That kind of feedback teaches you while you trade, which gradually makes you a better analyst.
Nevertheless, one truth will not change. Tools and technology inform decisions; they do not make them. The trader who understands why a signal appeared will always outperform the trader who blindly follows arrows.
Final Thoughts
The algo indicator landscape of 2026 rewards clarity over complexity. Adaptive logic beats fixed settings inside any algo indicator. Context beats raw speed. Tested results beat confident screenshots. If you apply that standard consistently, you will filter out most of the noise in this industry within an afternoon.
At GainzAlgo, we built our tools around exactly that philosophy. Our algo indicator focuses on clean, non-repainting buy and sell signals, backed by transparent multi-year backtests across major pairs and timeframes. We publish our results, explain our logic in plain English, and keep the chart simple enough to trade with confidence.
2819 people like this


About Premium Author
This post has been authored and published by one of our premium contributors, who are experts in their fields. They bring high-quality, well-researched content that adds significant value to our platform.
Leave a Reply
Please login to post a comment.








0 Comments