

Order Block Indicator on TradingView: Quick Setup Guide
- afaq anser35
- Business
- 2026-11-03 20:16:59
- 2837K
Price rarely moves in a straight line. Instead, it reacts to zones where large players once placed heavy orders. These zones are called order blocks, and they often act as future support or resistance.
However, marking them by hand on every chart takes time. It also takes a trained eye. That is exactly where an order block indicator helps. It scans past candles, highlights likely institutional zones, and updates them as new price data prints. As a result, you spend less time drawing boxes and more time reading the market.
In this guide, you will learn what order blocks are and how to identify order blocks manually. After that, we will walk through how to set up an order block indicator on TradingView, step by step. Finally, we will cover practical settings, trading tips, and the mistakes I see traders make most often.
What Is an Order Block?
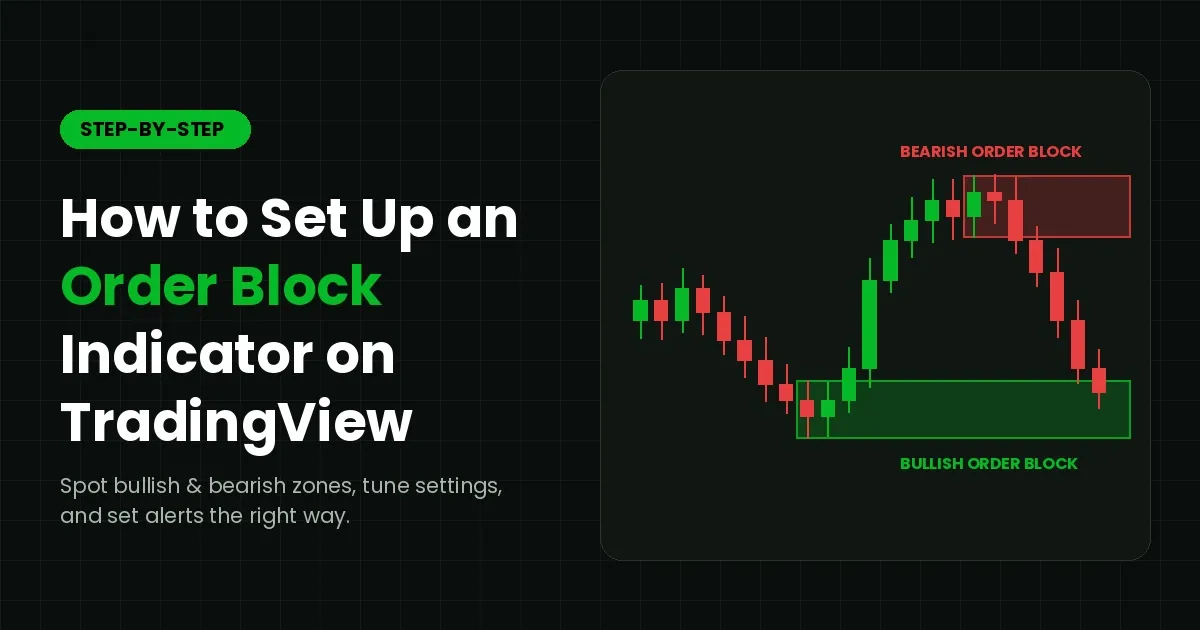
An order block is the last opposing candle, or a small cluster of candles, before a strong impulsive move. For example, the final down candle before a sharp rally often marks where buyers built their positions. Similarly, the last up candle before a heavy sell-off often shows where sellers stepped in.
Why does this happen? Banks and funds cannot fill huge orders at one single price. Therefore, they spread those orders across a price zone. When price later returns to that zone, some unfilled orders may still be waiting. Consequently, price often pauses, bounces, or reverses there.
Bullish and Bearish Order Blocks
Understanding bullish and bearish order blocks is the foundation of this whole approach. Both types follow the same logic, but they point in opposite directions.
- Bullish order block: This is the last bearish candle before a strong upward move. When price returns to this zone, it may find support.
- Bearish order block: This is the last bullish candle before a strong downward move. When price returns to this zone, it may meet resistance.
In both cases, the move away from the zone should be fast and decisive. Ideally, it also breaks a recent swing high or swing low. Without that displacement, the zone is usually weak and less reliable.
How to Identify Order Blocks Manually
Before you rely on any tool, it pays to know how to identify order blocks yourself. This way, you can judge whether an indicator is marking sensible zones or just random candles.
Follow this simple five-step process:
- Spot the displacement. Look for a strong, fast move made of large-bodied candles. Small, choppy moves rarely leave meaningful zones behind.
- Find the last opposing candle. Before a rally, locate the final red candle. Before a drop, locate the final green candle.
- Mark the zone. Draw a box from the high to the low of that candle. Some traders use only the body for a tighter zone.
- Confirm a break of structure. The move should break a previous swing high or low. This shows that real intent sits behind it.
- Check if it is still fresh. A zone that price has not revisited yet is called unmitigated. Fresh zones usually carry more weight than tested ones.
Practice this on old charts first. In my experience, traders who skip this step tend to trust every box an indicator draws. Unfortunately, that habit leads to poor entries and early stop-outs.
Why Use an Order Block Indicator?
Manual marking works well, but it has clear limits. For instance, you might miss zones on lower timeframes. You might also forget to remove zones that price has already broken. An order block indicator solves many of these problems at once.
Here is what a good order block indicator brings to your chart:
- Speed: Zones are drawn instantly across any symbol or timeframe.
- Consistency: The same rules are applied every time, so personal bias is reduced.
- Mitigation tracking: Broken or tested zones can be removed or faded automatically.
- Alerts: You can be notified when price enters a zone, even when you are away from the screen.
That said, an indicator does not replace judgment. It is a filter, not a signal machine. You still need context, such as trend direction and key liquidity levels, before acting on any zone.
How to Set Up an Order Block Indicator on TradingView (Step-by-Step)
Now let's get practical. The steps below work on both the free and paid TradingView plans. Note that free accounts limit how many indicators can be added to one chart, so keep your layout lean.
Step 1: Open Your Chart
First, log in to TradingView and open the Supercharts view. Next, type the symbol you trade into the search box at the top left. For example, you might load EUR/USD, BTC/USD, or a stock such as AAPL. Then pick the timeframe you normally analyse.
Step 2: Open the Indicators Menu
Click the Indicators button on the top toolbar. Alternatively, press the forward slash key (/) on your keyboard. A search window will appear with several tabs.
Step 3: Search for an Order Block Indicator
Type "order block" into the search bar. Then open the Community tab, where scripts built by other traders are listed. You will usually see dozens of results, so be selective. Before choosing one, check these points:
- How many boosts and positive comments it has received
- When it was last updated
- Whether the source code is open, so its logic can be reviewed
- Whether the description clearly explains how zones are detected
Step 4: Add It to Your Chart
Click the indicator name once, and it will be added to your chart straight away. Close the search window to see the result. You should now see shaded boxes above and below price. Tip: click the star icon next to the name to save it in your Favourites for quick access later.
Step 5: Open the Settings Panel
Hover over the indicator name at the top left of the chart. Then click the gear icon. Alternatively, double-click any box the indicator has drawn. The settings window opens with two main tabs: Inputs and Style.
Step 6: Adjust the Key Inputs
Input names differ between scripts. However, most order block indicators share a similar set of options:
- Swing length or lookback: This controls how far back the script looks to confirm a swing point. Higher values produce fewer but stronger zones.
- Number of zones shown: Limit this to three to five per side. Otherwise, your chart quickly becomes cluttered.
- Mitigation method: Choose whether a zone is removed when a wick touches it or only when a candle closes through it. Close-based removal is generally less noisy.
- Show bullish and bearish zones: Toggle each type on or off, depending on your bias.
- Extend zones: Decide whether boxes stretch to the right edge of the chart.
Step 7: Customise the Style
Next, switch to the Style tab. Assign a green shade to bullish zones and a red shade to bearish zones. Then raise the transparency to around 70 to 80 percent. This keeps candles readable, even when they sit inside a zone.
Step 8: Create Alerts
Alerts are where an order block indicator really saves time. Click the Alert icon on the right panel, or press Alt + A. In the Condition field, select your indicator. Then pick the event you want, such as "price enters bullish zone," if the script offers it. Finally, set the frequency to "Once Per Bar Close" to avoid false triggers.
Step 9: Save Your Setup
Lastly, protect your work. Click the indicator's three-dot menu, choose Save as default, or save the full chart layout. That way, your settings load automatically every time you open a new chart.
Recommended Settings for Different Trading Styles
There is no single perfect setting. Instead, your settings should match the way you trade.
Scalpers working on the 1-minute to 5-minute charts can use a shorter swing length, such as 5 to 7. Because price moves quickly, wick-based mitigation helps clear old zones fast.
Day traders on the 15-minute to 1-hour charts usually do well with a swing length of around 10. In addition, close-based mitigation keeps the chart cleaner during volatile sessions.
Swing traders on the 4-hour and daily charts can raise the swing length to 15 or 20. As a result, only the most significant zones remain visible.
How to Trade Using an Order Block Indicator
A zone alone is not a trade. Rather, it is a location where a trade might make sense. To improve your odds, look for confluence before you act:
- Higher timeframe trend: Favour bullish zones in an uptrend and bearish zones in a downtrend.
- Liquidity sweep: A quick spike beyond a recent high or low, just before price reaches the zone, often strengthens the setup.
- Fair value gap: An imbalance left near the zone adds extra weight.
- Lower timeframe confirmation: Wait for a small break of structure inside the zone before entering.
For risk management, place your stop just beyond the far edge of the zone. Then target the next opposing zone or a clear liquidity pool. Above all, risk only a small, fixed percentage of your account on each trade.
Common Mistakes to Avoid
Even with a well-built order block indicator, traders often fall into the same traps. Watch out for these:
- Trading every zone. Not every box deserves your money. Focus on fresh zones that align with the trend.
- Ignoring the higher timeframe. A bullish zone on the 5-minute chart means little if the daily chart is falling hard.
- Using a tiny lookback. Very low swing settings flood the chart with weak zones.
- Treating tested zones as fresh. Once a zone has been mitigated, its strength is usually reduced.
- Skipping the backtest. Always test your settings on historical data, and then on a demo account, before trading live.
Final Thoughts
Setting up an order block indicator on TradingView takes only a few minutes. Using it well, however, takes patience and practice. Start by learning how to identify order blocks by hand, so you understand what the script is showing you. Then tune your settings, add alerts, and combine each zone with trend and liquidity context.
When comparing tools, many traders also search phrases like "is gainzalgo legit" before trying a script. That is a healthy habit. Whether you are reviewing GainzAlgo or any other order block indicator, the honest answer comes from your own testing. Read how the tool works, backtest it on historical data, and run it on a demo account first. Ultimately, no indicator guarantees profits, so let verified results and sound risk management guide your decision.
2837 people like this

About Premium Author
This post has been authored and published by one of our premium contributors, who are experts in their fields. They bring high-quality, well-researched content that adds significant value to our platform.
Leave a Reply
Please login to post a comment.






0 Comments